Is neoliberalism to blame for Orbàn and Le Pen?
Populism is on the rise, especially in Europe. Determining the causes is of crucial political importance. Some claim that ”neoliberal” policies such as deregulation and free trade have contributed to the populist tide. This briefing conducts a statistical analysis of 31 European countries over a 34-year period. Neoliberalism is proxied by the Economic Freedom of the World index and the data source for populism is the Timbro Authoritarian Populism Index. The data does not support the hypothesis that economic freedom leads to increased support for populist parties. If anything, there is a negative relationship between the two variables, although mostly not statistically significant. Expanding the size of the public sector and rolling back globalisation as policy measures against populism should therefore be expected to be ineffective at best and counterproductive at worst.
This report is co-published with our European partner Epicenter. Download the pdf version at Epicenter’s website.
Introduction
When looking back at elections in Europe over the past four decades, we see that populism is not a newfound preference among European voters. However, support for populist alternatives showed a clear upward trend during the 2000s. Finding explanations for why electorates embrace populist parties is therefore important.
This briefing examines one particular hypothesis: that free-market policies such as low taxes and free trade have spurred populism. I show that these claims have no support in real world data. There is no positive association between economic freedom and populism on the country level – if anything, there appears to be a negative association, although the estimates are not statistically significant in most cases.
I use the Fraser Institute’s index of economic freedom as a measurement of how liberalised a country is. Populism is measured by the Timbro Authoritarian Populism Index, which tracks electoral support for populist parties in Europe. Thus I am able to study how populism and economic freedom correlate in 31 countries over 34 years.
“Neoliberalism” as a driver of populism
A potential explanation for the rise of populism is what some refer to as the neoliberal agenda of the 1990s and early 2000s.[1] During this era, the world experienced increasingly free trade, and many countries reformed their economies in a more liberal direction. Could it be that lower tax rates, privatisation, and globalisation have pushed voters into the arms of populists? That certainly has been claimed to be the case. Sweden’s Minister of Finance asserted that larger gaps between the poor and the wealthy, caused by tax cuts, have been a major driving force behind the rise of populism (Victorzon 2016). She proceeded to declare the era of tax cuts to be over and instead decided to increase several taxes. This claim was echoed by political scientist Sverker Gustavsson (2017), who suggested that neoliberalism had caused the rise of populism not only in Sweden, but on a global level. Neoliberalism has also been put forward as an explanation for the rise of Donald Trump (Monbiot 2016).
These claims should not be dismissed out of hand. When the future is less predictable and the world is changing at a more rapid pace, people long for a more stable existence. A more liberal society is a more dynamic society. As the Austrian economist Joseph Schumpeter noted, capitalism is characterised by creative destruction. It is understandable that some people like the more predictable future promised by leaders with a more authoritarian approach.
Free trade is one of the neoliberal prescriptions which make the future more dynamic and less certain. Tougher competition on the international market may ine the short run cause a loss of domestic jobs, prompting many to vote for political alternatives that promise to increase tariffs and regulations in order to protect domestic industries. Recent examples abound. Donald Trump promised to “put America first” and to prevent jobs from moving overseas. Countries in Central and Eastern Europe, many of which were swiftly reformed after the collapse of the Soviet Union in 1989, are far different from what they were during the times of state socialism.
Descriptive statistics and definitions
In economics, a suitable concept to capture the sway of “neoliberal” policies is economic freedom. A country characterised by a high degree of economic freedom, in short, has low taxes, is open to international trade, and its citizens enjoy strong and reliable property rights. There are many ways one could measure this, but the measure most commonly used in economic research is the index published in the Economic Freedom of the World reports by the Fraser Institute (Berggren 2003). Data is available every five years from 1970 to 2000 and annually since 2000.
In the index, countries are rated on a scale from 0 to 10 in five different areas, and the scores are averaged to compile the overall rating of economic freedom.[2]
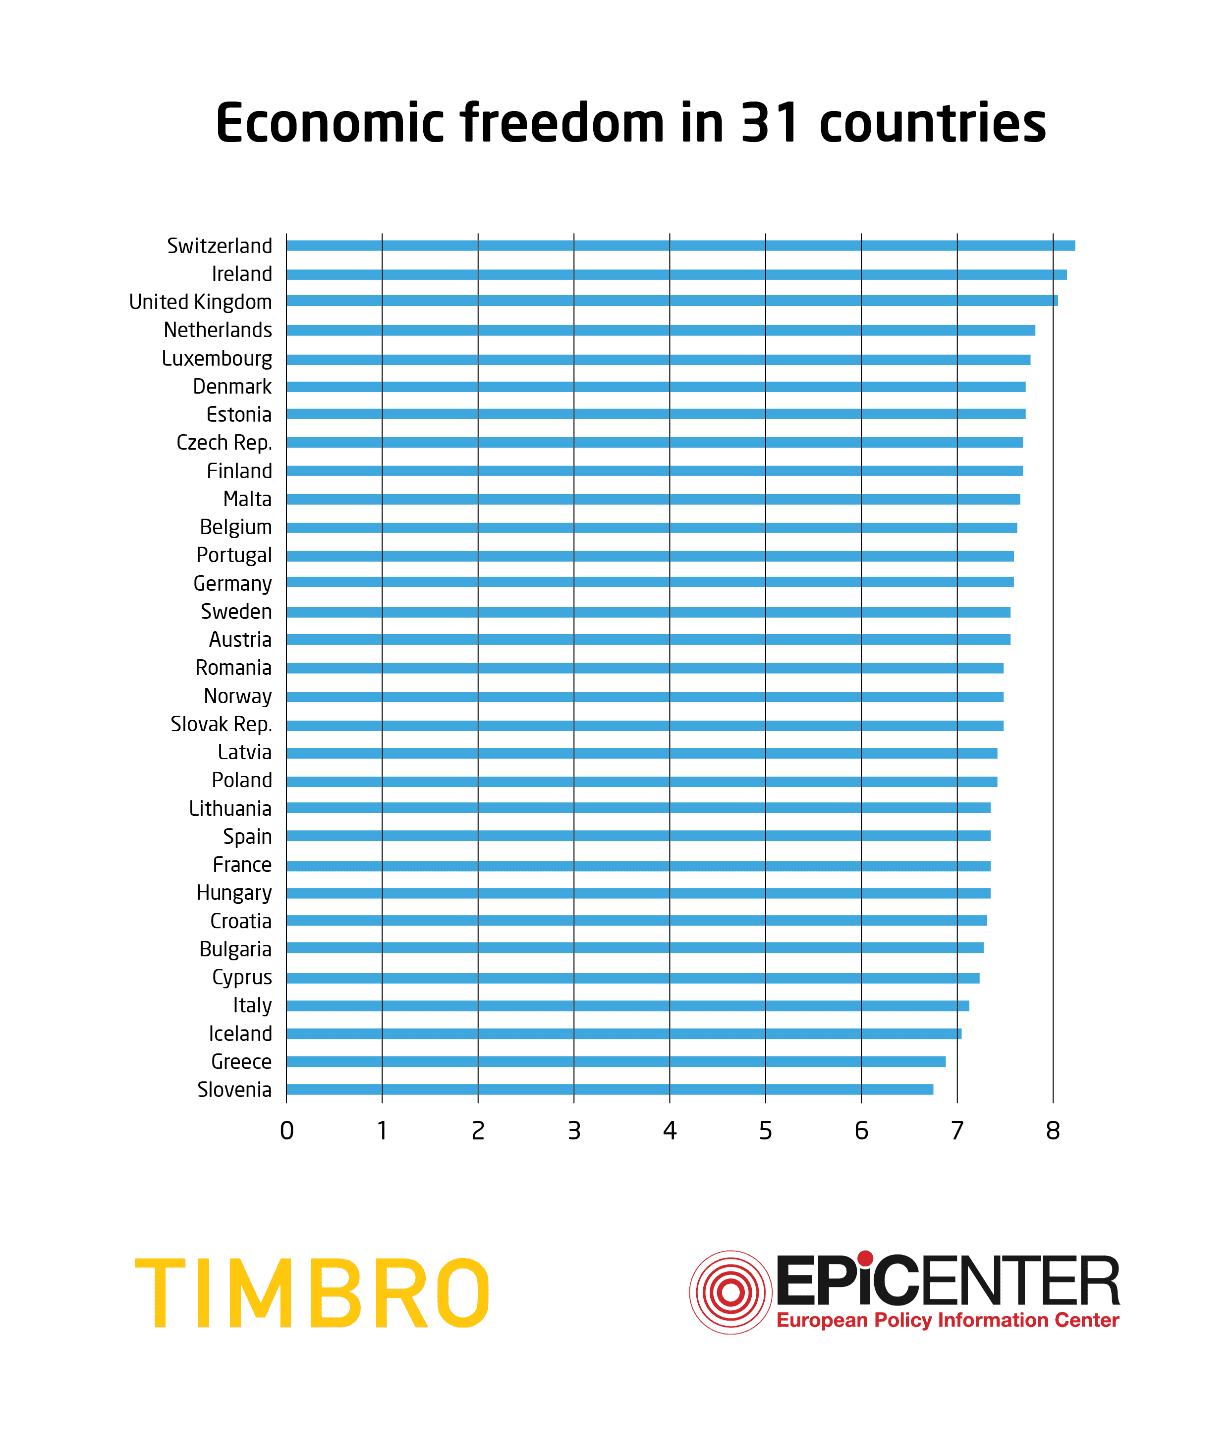
The ratings are primarily based on official data available to the public, such as tax revenue as a share of GDP, customs duties, and public expenditures. The economic freedom ratings for the countries examines in this briefing are plotted in Figure 2.[3]
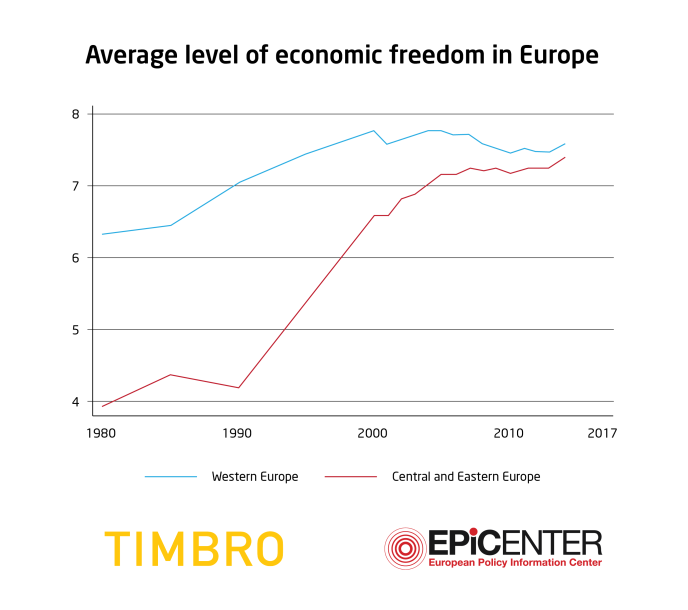
In the democratic countries of Europe, there was a large increase in economic freedom until the year 2000, after which economic freedom ceased to increase. The largest increase was seen in Central and Eastern European countries that reformed their economies after the fall of communism. This can be seen in Figure 1, where I plot economic freedom in Western Europe and Central and Eastern Europe, respectively. Today, European countries do not differ nearly as substantially in their economic freedom. Although some of the most economically free countries in the world are found in Europe, none of the least free are.
To measure populism, this paper relies on the work of Andreas Johansson Heinö and Timbro, which publishes the Timbro Authoritarian Populism Index.[4] Authoritarian populism, according to the author, is characterized by a critique of what adherents perceive as the elite, disapproval of the rule of law, criticism of the EU, a dislike of free trade, etc.
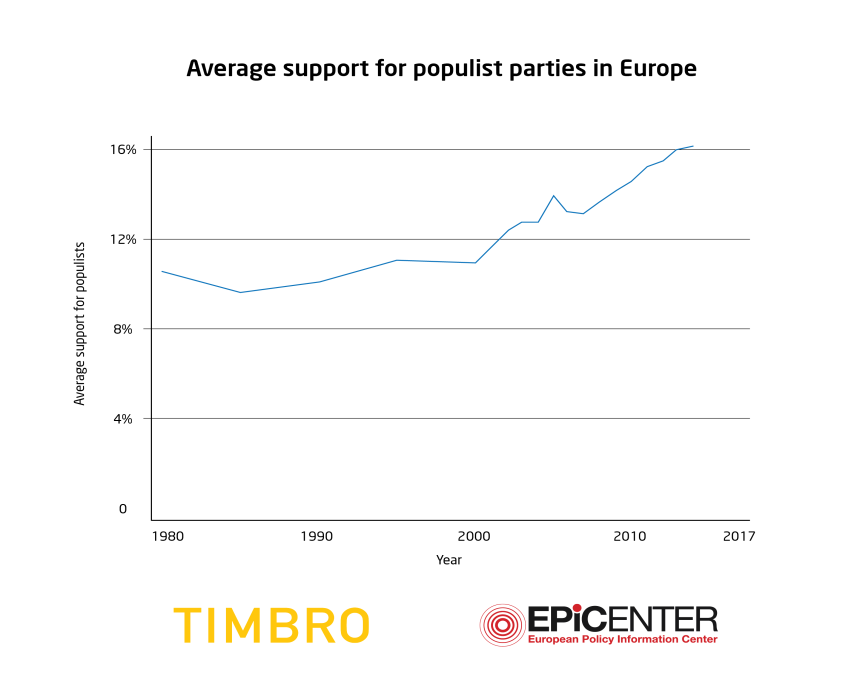
The index maps the share of votes for populist parties in Europe since 1980. What is found in the latest edition is that right-wing populism currently is at an all-time high for the time period studied, although it appears to have stagnated. At the same time, we see what could be described as a resurgence of left-wing populism. The total support for authoritarian populist parties is shown in Figure 3.
Methodology
The statistical model used is linear regression, with the share of votes for populists in the national parliamentary elections as the dependent variable. That is, I try to estimate what effects other variables have on the share of populist votes in a country. The variable of interest is economic freedom as measured by the Fraser Institute.
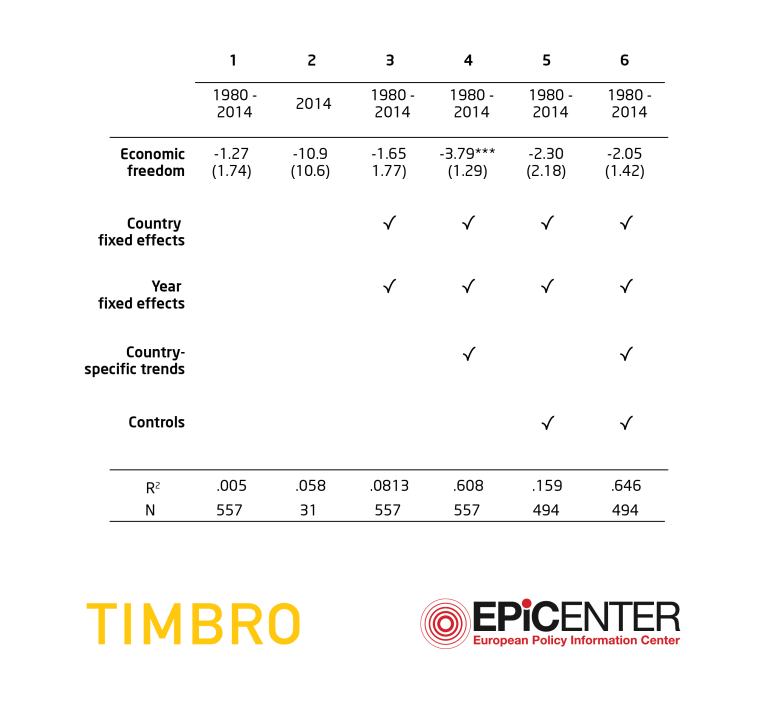
The results are shown in Table 1. Column 1 is a simple regression without control variables or any fixed effects or trends. Column 2 is the same regression as in column 1, but only for the last year for which there are data (2014), which is why the sample size decreases substantially in this regression.
However, there are many reasons one could think that these regressions do not capture the true causal impact of economic freedom on populism. For this reason, a series of controls is implemented stepwise in columns 3 to 6.
One econometric challenge is pan-European trends. If, for example, economic freedom and populism have increased over time due to a third, unrelated factor, this would bias the regressions. Because the dataset is a panel – I have observations of populism and economic freedom for individual countries over several years – I am able to control for this by introducing year fixed effects. This removes the effects of time-varying factors that are common to all European countries.
Another potential source of bias is unobserved heterogeneity among countries. Some countries may have more or less populism or economic freedom for historical, cultural or other reasons. E.g., some countries have been democracies for a longer period of time than others and countries have different electoral systems. I control for this using country fixed effects, i.e., dummy variables for each country that absorb time-invariant country characteristics.
The presence of both year and country fixed effects implies that the variation used is the evolution of populism across time within each country, controlling for pan-European trends in populism. Intuitively, the regression captures whether an increase in economic freedom in a certain country is associated with an increase in authoritarian populism in that country, over and above any increase in the average level of populism in Europe. This regression is shown in column 3 in Table 1.
In column 4, I control for country-specific linear trends in authoritarian populism. This removes the effects of any long-term increase in populism in a particular country. Thus, the regression captures the association between economic freedom and populism, over and above pan-European developments and the linear trend in the country concerned.
One could also imagine that other factors influence both economic freedom and populism and thus cause incorrect conclusions about causality to be drawn (so-called omitted variable bias). Therefore, in columns 5 and 6 I introduce two control variables. Eurosceptic sentiments across Europe might, of course, be explained by the fact that all but three countries in the data set are members of the European Union. Therefore, introducing a dummy variable indicating whether a country is a member of the EU seems reasonable. It is also easy to imagine that the economic fortunes of a country could affect the support for populist parties, so GDP per capita is also added as a control variable. Recall that time-invariant country characteristics are absorbed by the country fixed effects, so the control variables only matter insofar as they vary over time.
Lastly, we cannot look past the possibility that the causality might be reversed, so that populism has an effect on economic freedom. Rode and Revuelta (2015) find that populist influence decreases economic freedom, regardless of whether it is right-wing or left-wing populists that are gaining influence. If the findings of Rode and Revuelta (2015) are correct, the regressions in this briefing paper would be underestimating the causal impact of economic freedom on populism because a larger populist influence would be associated with a lower degree of economic freedom (so-called simultaneous causality bias).
Results
Table 1 shows the results from the different regressions. These regressions use the entire sample, i.e., all countries for which there are data between 1980 and 2014. The regressions are illustrated in figures 4–9. As we can see in all figures, the linear relationship is always sloping downwards, although the coefficients are mostly not statistically significant.
This paper finds no support for the hypothesis that neoliberalism has allowed for an increase in populism. On the contrary, authoritarian populism correlates negatively with economic freedom.
The results are not very stable and depend on what factors are controlled for in the different estimations. All estimates are, however, negative, even though all but one are statistically insignificant. We can interpret the results in the following way, using the estimate in column 1 as an example: a one-unit increase in the economic freedom index is associated with a 1.27 percentage point lower support for populist parties. For instance, moving from the 2014 level of economic freedom in Greece to that of Ireland is associated with a 1.27 percentage-point decrease in support for populists. It can be concluded from Table 1 that a one-unit increase in economic freedom is associated with a decreased support for populists that ranges from 1.27 to 10.87 percentage points depending on which model is used.
The results cast doubt on the claim that neoliberalism is a driver of populism.
Conclusions
This briefing finds no support for the hypothesis that the rise of “neoliberalism” in the form of deregulation, tax reform, free trade etc. has created resentment and contributed to populist sentiment. If anything, the opposite appears to be the case. Over a 30-year period, authoritarian populism correlates negatively with economic freedom across European countries.
These results are in line with the conclusions in the latest Economic Freedom of the World report, where Chaitanya Vadlamannati and Soysa (2017), using a different measure, examined the support for right-wing populism in 27 OECD countries over 25 years. While their main variable of interest was the share of immigrants, they find a statistically significant negative relationship between populism and economic freedom in all regression specifications.
Europe will likely continue to have a large share of voters turning to populist alternatives in the near future. What kind of policies individual governments and the European Union choose to implement will probably matter for the demand for populism. Politicians could increase taxes, expand regulations, and combat globalisation, or do the opposite and liberalise the economy.
The statistical results of this briefing suggest that expanding the public sector and increasing taxes in order to combat populism, as some are calling for, would at best be ineffective and at worst lead to more authoritarian populism.
References
Berggren, N. (2003). “The Benefits of Economic Freedom: A Survey”. The Independent Review, Vol. 8, No. 2: 193– 211.
Gwartney, James, Hall, Joshua and Lawson, Robert (2015). Economic Freedom of the World: 2015 Annual Report. Vancouver: Fraser Institute.
Sverker Gustavsson (2017). ”Den fantasilösa ekonomismen har undergrävt demokratin”. Dagens Nyheter, 23 April, http://www.dn.se/arkiv/kultur/den-fantasilosa-ekonomismen-har-undergravt-demokratin/ Accessed 2017-07-15.
Andreas Johansson Heinö (2017). “Timbro Authoritarian Populism Index 2017”, Stockholm: Timbro.
Krishna Chaitanya Vadlamannati and Indra de Soysa (2017). ”Economic Freedom, Social Protections, and Electoral Support for Anti-Immigrant Populist Parties in 27 Industrial Democracies”. In Gwartney, James, Hall, Joshua and Lawson, Robert (Eds), Economic Freedom of the World: 2017 Annual Report (pp. 213–243). Vancouver: Fraser Institute.
George Monbiot (2016). “Neoliberalism – the ideology at the root of all our problems”. The Guardian, 15 April, https://www.theguardian.com/books/2016/apr/15/neoliberalism-ideology-problem-george-monbiot, Accessed 2017-08-15
Rode, Martin, and Revuelta, Julio (2015). “The Wild Bunch! An Empirical Note on Populism and Economic Institutions”. Economics of Governance, vol. 16, No. 1: 73-96.
Daniel Swedin, (2017). ”Vänstern förlorar när de inte förstår sina väljare”. Aftonbladet. https://www.aftonbladet.se/ledare/a/GvQ74/vanstern-forlorar-nar-de-inte-forstar-sina-valjare (accessed 24 October).
Dag Einar Thorsen (2010). “The Neoliberal Challenge: What is Neoliberatism?”. Contemporary Readings in Law and Social Justice, Vol. 2, No. 2: 188-214.
Andreas Victorzon (2016). ”Andersson: Eran av stora skattesänkningar är över”. Omni, 26 December, http://omni.se/andersson-eran-av-stora-skattesankningar-ar-over/a/0d1pE Accessed 2017-08-22.
Appendix
The regression specification and scatterplots corresponding to the regressions are given in the appendix in the pdf version.
Endnotes
- This term could, however, be problematized. See Thorsen (2009) for a good discussion on this. ↑
- The methodology for compiling the ratings is published in Gwartney, Hall, and Lawson (2015). ↑
- The countries I use are the same as Johansson Heinö 2017 with the difference that I do not use Serbia or Montenegro because the Fraser Institute’s data set lacks observations for these countries. ↑
- Johansson Heinö (2017) ↑